
Swiss Address Visualization with WebGL
29a.ch/sandbox/2011/addresscloud/
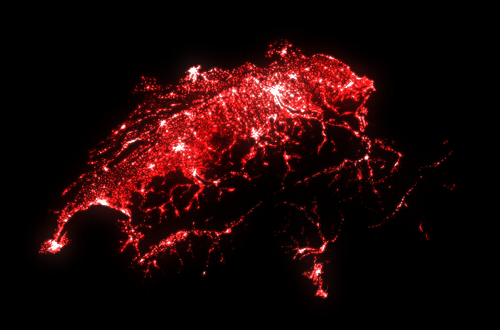
As some of you know I work for local.ch. I was looking for cool visualizations to do with our data for quite a while, missing the obvious - plotting all our 3.7 million geocoded addresses in 3D using WebGL! I'm actually quite impressed by the accuracy of the data. But go and have a look for your self.
Controls
WASD + Mouse (drag). Velocity is scaled with altitude.
Video
If you can't see the demo for some reason I uploaded a short video of the demo to youtube.
Techniques
The points are encoded in a Float32Array, then sorted and gziped using a python script. Sorting the data improves the compression ratio by over 200% so it's well worth the effort. This brings the original 100mb file down to 7mb.
The file is then loaded using XHR level 2, which supports binary files and progress events. The points are then rendered using WebGL as GL_POINTS and additive blending is used to give it a glow effect. In the future I might add HDR rendering and blooming.
There is no level of detail or culling performed so this will require a relatively powerful rig. Also note that for some reason Firefox Aurora (9) seems to be quicker than Chrome Dev (16) for some mysterious reason. I would expect all of the work to be done by OpenGL so I'm not sure about where this comes from. It could be chromes process isolation.
Sourcecode
You can find the source code on github if you want to get into some hacking. Note that the data belongs to local.ch and may not be used.